A Deep Dive into Logs and Metrics for AWS Observability — One Observability Workshop

Introduction
Holiday Greetings! It’s that time of the year where we celebrate our accomplishments of the year as well as take stock of what went well as well as the areas of improvement.
Before we get into the deep dive I would like to recognize the Challenge that inspired this post. I am excited that I completed the #12WeekAWSWorkshopChallenge after attending the final session on Observability today led by Indika Wimalasuriya and hosted by Chi Che, AWS Usergroup Yaounde Organizer.
The session was full of insights and a combination of demo, industry experiences and most importantly an emphasis on understanding the concepts behind observability.

Observability Concepts
What is Observability? Observability is the ability to gain insight into the internal workings and behavior of a system or application through analysis of its outputs, often without direct access to its internal state.

How exactly can the internal state of a system be known? With proper applications in place, forms of communication called signals are emitted that provide quality information to monitor the internal state of the system known as observability.

Why is Observability important?
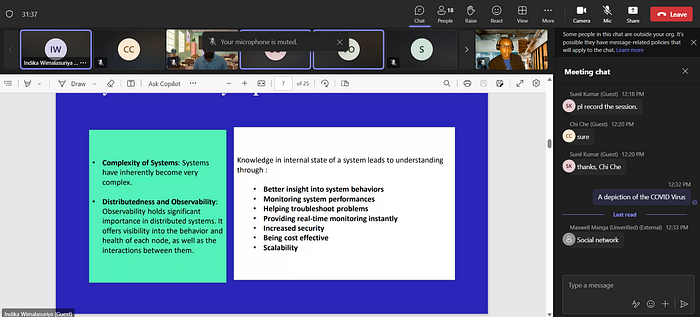
- Complexity of Systems: Systems have inherently become very complex
- Distributedness: Is important in distributed systems sine it offers visibility into the behavior and health of each node as well as interactions between them.
Why should you be serious about observability?
Take a look at these statistics from three organizations that became intentional about Observability.
Walmart found that for every 1 second improvement in page load time, conversions increased by 2%.
COOK increased conversions by 7% by reducing page load time by 0.85 seconds.
Mobify found that each 100ms improvement in their homepage’s load time resulted in 1.11% increase in conversion.

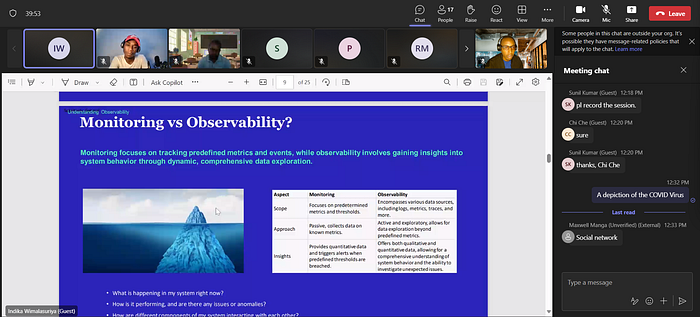
What is the difference between Monitoring and Observability?
Monitoring focus on tracking predefined metrics and events, while observability involves gaining insights into system behavior through dynamic, comprehensive data exploration.
Observability signals:
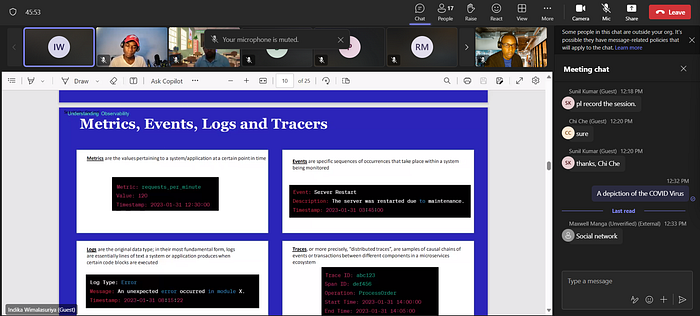
Logs are the original data type; in their most fundamental form, logs are essentially lines of text a system or application produces when certain code blocks are executed.
Metrics are the values pertaining to a system/application at a certain point in time.
Events are specific sequences of occurrences that take place within a system being monitored.
Traces are samples of causal chains of events or transactions between different components in a microservices ecosystem.
In this article, we will focus on logs and metrics.
What is full stack observability?
A quick check with Amazon Q defines full stack observability as: the practice of monitoring and gathering insights across all layers of a software application or system. This includes infrastructure, networks, applications, databases and services.
The goal is to provide visibility into how the entire tech stack is performing end-to-end with the aim of helping engineering teams quickly identify and resolve issues when they occur.

Full stack observability encompasses Real-time User Monitoring (RUM), Application Performance Monitoring (APM), Distributed Tracing, Logs & Events, Metrics and Infrastructure Monitoring. This concept is beyond the scope of this article hence will not be covered in detail.

AWS Observability Options
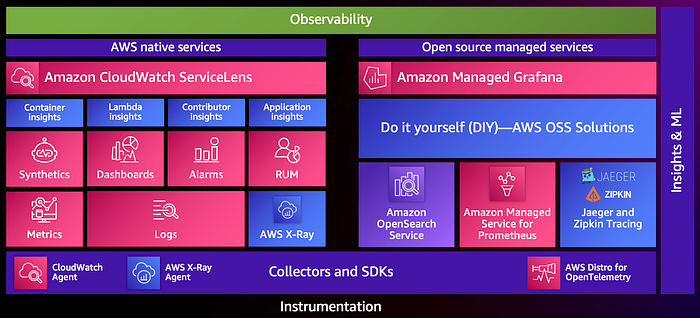
AWS offers two main observability options:
AWS native services and AWS Open source managed services. In this article we are mainly interacting with CloudWatch. A discussion during the session highlighted that most of these tools started out as monitoring tools but have evolved into observability tools.
I also asked Indika Wimalasuriya when it is best suited to choose open source tools over the AWS native tools and vice-versa. He answered by highlighted that although it depends to the business needs as well the organizational culture, the optimal way to draw the line is that for small to medium-sized companies then open source may be the way to go.
Larger enterprises with more complex workloads would prefer native tools as the providers offset the heavy lifting required of managing these tools by having a dedicated in-house engineering team for that specific purpose. It seems that it all boils down to organizational culture and the business needs.
Deep dive on AWS Observability (Logs and Metrics through the One Observability Workshop
This deep dive is based on the AWS One Observability Workshop so instead of outlining the steps which can be found on the Workshop link, I will share my experience and insights from the workshop specifically on the sections on Logs and Metrics.
I completed this workshop in my own AWS account and it took me about 2 hours (the complete workshop takes ~4 hours) with a minimal cost of ~$5 after cleaning up resources immediately after the workshop activities. This is an intermediate level workshop hence it expects that the learner has experience using multiple AWS services. You don’t need to be an expert to take this particular workshop however it will help if you had some basic understanding about concepts such as logs , metrics , traces , alarms , dashboards and more. The very reason why we started with the concepts.
Using your own AWS Account entails leveraging Cloud9 to deploy the PetAdoptions application. This includes setting up the Cloud9 environment takes a bit of time (~ 15 Minutes) as it involves deploying a Cloudformation Stacks that launch the resources needed to complete the workshop.
After completing Step 16 of the Deploy Application section shown:

After executing the command, output of a successful deployment will be similar to the one shown:

Application Architecture
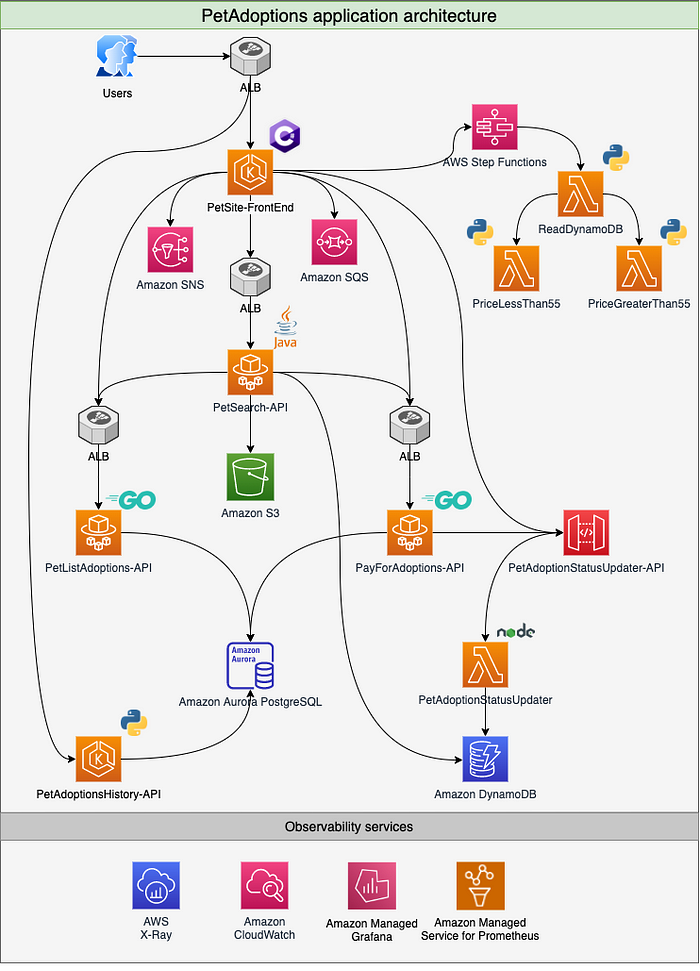
Although this section is optional within the workshop, it is a critical step in understanding the PetAdoptions application whose telemetry are being observed.
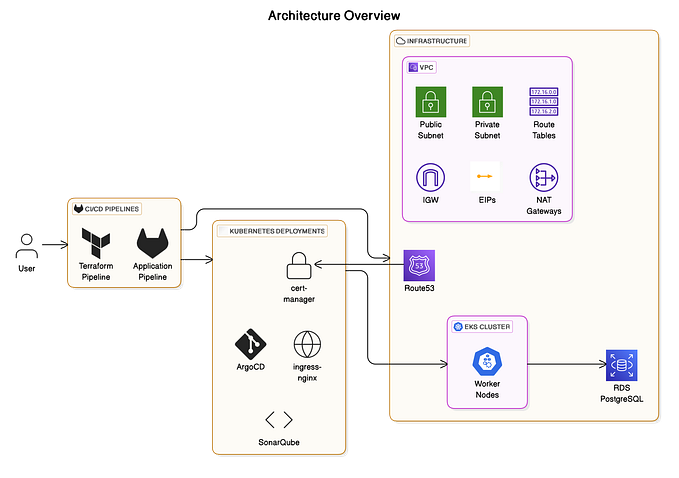
The architecture diagram illustrates the various components of the PetAdoptions application which is deployed in EKS and leverages Cloudwatch for Logs and Metrics Observability.
After retrieving the pet adoption website URL either via Cloud9 or the CloudFormation console, opening it on the browser will give you a similar output as below:


In very rare cases, you might encounter a behavior where the site does not show any pet images. Click on Perform Housekeeping in the PetSite home page upper right corner.
For AWS, Full-stack observability involves AWS-native, Application Performance Monitoring (APM), and open-source solutions, giving you the ability to understand what is happening across your technology stack at any time.
CloudWatch Logs
From the workshop, here are the key highlights on CloudWatch logs:
CloudWatch Logs enables you to centralize the logs from all of your systems, applications, and AWS services that you use, in a single, highly scalable service.
CloudWatch Logs Insights enables you to interactively search and analyze your log data in Amazon CloudWatch Logs. You can perform queries to help you more efficiently and effectively respond to operational issues. If an issue occurs, you can use CloudWatch Logs Insights to identify potential causes and validate deployed fixes.
CloudWatch Logs Insights automatically discovers fields in logs from AWS services such as Amazon Route 53, AWS Lambda, AWS CloudTrail, and Amazon VPC, and any application or custom log that emits log events as JSON.
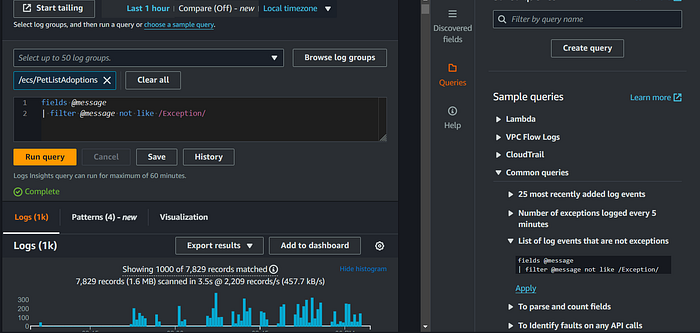
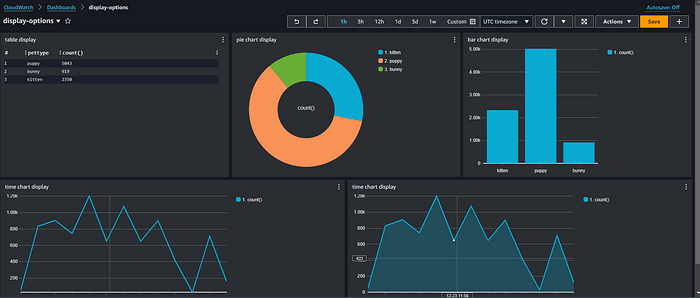
After completing the steps on Navigating the Interface, and Querying you should see the outputs below:




Why is it useful to break the logs data into fields?
Separating our data into fields allows us to choose what to display, as well as to aggregate or apply logic to the data/fields we are interested in.
In this example we’re going to run a query to use the logs from the petsite application and look for adoption events. We want to see the pattern of adoptions of different types of pets over time.

stats command
| stats sum(type="puppy") as puppy, sum(type="kitten") as kitten, sum(type="bunny") as bunny by bin(5m)- We used a stats command with the sum function.
- Within the sum function we specified what to sum: i.e. all events which have a type value of “puppy”.
- We gave a name for the sum result, i.e. puppy.
- We did this 3 times, once for each pet type.
- We grouped the sum over 5 minute time buckets.
The use of the sum function instead of the count function is important here. We have to use sum instead of count here, as the condition type=”puppy” will return a 1 or a 0 for every event. Count would count all 1’s and 0’s, essentially counting all events. Sum will effectively count those with a value of 1, or where type=”puppy” is true.

Why is it useful to use the pattern syntax?
Searching and filtering through large volumes of logs can be challenging especially when you are on a time crunch to investigate errors faster. Querying using pattern syntax can help you identify high-cost log lines, monitor known errors, find recurrent patterns in your logs and provide you a count of the matched pattern sorted by severity level.
Running the query below:
filter @message like /Error Code: AccessDenied/
| pattern @message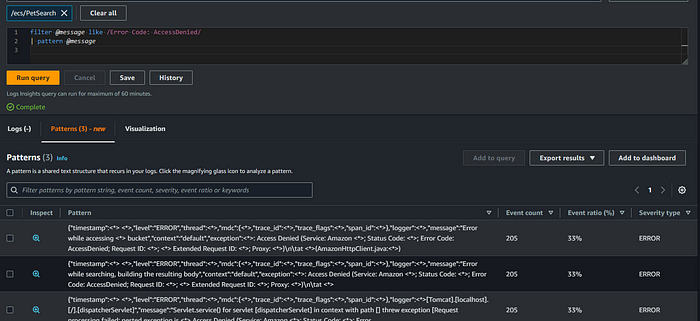
filter @message like /ERROR/
| parse @message 'Error Code: *' as errcode
| pattern errcode
Querying — using dedup
In this section, we are going to explore the dedup syntax. The dedup syntax allows you to remove duplicate results from your logs based on the specific field values.

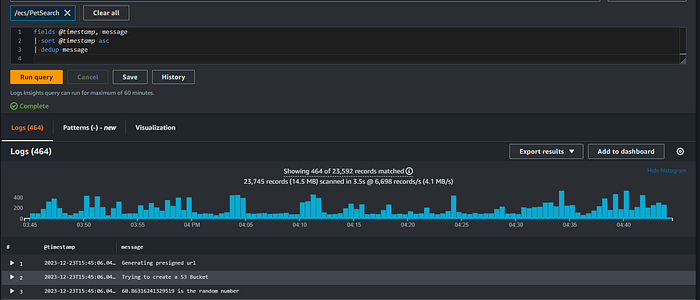
You will see here that dedup removes the duplicates and lists only the unique messages which are 464 in this case.

dedup for slow function invocations
dedup also helps to search for slow function invocations, and eliminate duplicate requests that can arise from retries or client-side code, for example dedup @requestID.
dedup for network troubleshooting
dedup comes in very handy when you want to check logs events from unique server field with a severity type. When used with filter syntax, it also helps to troubleshoot network connectivity issues by finding unique values from source or destination IP addresses in the vpc-flow-logs.
Live Tail
Live Tail is an analytics capability that provides a real-time interactive view of the logs, enabling fast detection and timely resolution of issues across an application lifecycle.
By using Live Tail on CloudWatch Logs, DevOps teams can quickly validate if a process has correctly started or if a new deployment has gone smoothly.


Data Protection
CloudWatch Logs data protection allows you to leverage pattern matching and machine learning models to detect sensitive data. The criteria and techniques used are referred to as managed data identifiers. The techniques can detect a large list of sensitive data types for many countries and regions, including financial data, personally identifiable information, and protected health information.
CloudWatch Logs data protection can detect the following categories of sensitive data by using managed data identifiers:
- Credentials, such as private keys or AWS secret access keys
- Financial information, such as credit card numbers
- Personally Identifiable Information (PII) such as driver’s licenses or social security numbers
- Protected Health Information (PHI) such as health insurance or medical identification numbers
- Device identifiers, such as IP addresses or MAC addresses
AWS recommends that you select only the data identifiers that are relevant for your log data and your business. Choosing many types of data can lead to false positives.
Prevention
There are several ways to avoid logging sensitive data,
- Constant peer review of the code,
- Putting in effort to understand and implementing methods to catch exceptions in the code which is logging all information but instead on necessary data required to debug the problem.
- Understand who has access to logs and what data needs to be logged
Beyond everything that is mentioned, there is still room for misconfiguration, and sensitive data might end of getting logged. Which is where CloudWatch Logs data protection comes in
Detection — CloudWatch Logs data protection implementation
CloudWatch Logs data protection employs named entity recognition techniques to identify information that could breach privacy and compliance regulations or expose your company to unnecessary security risk by scanning and performing actions on in-flight data.
Metrics
From the workshop, here are the key highlights on Metrics:
Metrics are data about the performance of your systems. By default, several services provide free metrics for resources (such as Amazon EC2 instances, Amazon EBS volumes, and Amazon RDS DB instances). You can also enable detailed monitoring for some resources, such as your Amazon EC2 instances, or publish your own application metrics.
Metric data is kept for 15 months, enabling you to view both up-to-the-minute data and historical data.


Math Expressions
Metric math enables you to query multiple CloudWatch metrics and use math expressions to create new time series based on these metrics. You can visualize the resulting time series on the CloudWatch console and add them to dashboards.
Search expressions
Search expressions are a type of math expression that you can add to CloudWatch graphs. Search expressions enable you to quickly add multiple related metrics to a graph. They also enable you to create dynamic graphs that automatically add appropriate metrics to their display, even if those metrics don’t exist when you first create the graph.
Publish custom Metrics
You can publish your own custom metrics in a variety of ways
Metrics Explorer
Metrics Explorer is a tag-based tool that enables you to filter, aggregate, and visualize your metrics by tags and resource properties to enhance observability for your services. Metrics Explorer visualizations are dynamic, so if a matching resource is created after you create a metrics explorer widget and add it to a CloudWatch dashboard, the new resource automatically appears in the explorer widget.
Metrics Insights
CloudWatch Metrics Insights is a powerful high-performance SQL query engine that you can use to query your metrics at scale. A single query can process up to 10,000 metrics, which was a blocker for customers before to identify trends and patterns with CloudWatch metrics at scale in real time.
Anomaly Detection
When you enable anomaly detection for a metric, CloudWatch applies machine learning algorithms to the metric’s past data to create a model of the metric’s expected values. The model assesses both trends and hourly, daily, and weekly patterns of the metric. The algorithm trains on up to two weeks of metric data, but you can enable anomaly detection on a metric even if the metric does not have a full two weeks of data.
Embedded Metric Format
The CloudWatch embedded metric format enables you to ingest complex high-cardinality application data in the form of logs and to generate actionable metrics from them. You can embed custom metrics alongside detailed log event data, and CloudWatch automatically extracts the custom metrics so that you can visualize and alarm on them, for real-time incident detection.
Embedded metric format helps you to generate actionable custom metrics from ephemeral resources such as Lambda functions and containers. By using the embedded metric format to send logs from these ephemeral resources, you can now easily create custom metrics without having to instrument or maintain separate code, while gaining powerful analytical capabilities on your log data.
Alarms
You can add alarms to CloudWatch dashboards and monitor them visually. When an alarm is on a dashboard, it turns red when it is in the ALARM state, making it easier for you to monitor its status proactively.
Alarms invoke actions for sustained state changes only. CloudWatch alarms don’t invoke actions simply because they are in a particular state, the state must have changed and been maintained for a specified number of periods.
After an alarm invokes an action due to a change in state, its subsequent behavior depends on the type of action that you have associated with the alarm. For Amazon EC2 Auto Scaling actions, the alarm continues to invoke the action for every period that the alarm remains in the new state. For Amazon SNS notifications, no additional actions are invoked.
You can create both metric alarms and composite alarms in CloudWatch.
- A
metric alarmwatches a single CloudWatch metric or the result of a math expression based on CloudWatch metrics. The alarm performs one or more actions based on the value of the metric or expression relative to a threshold over a number of time periods. The action can be an Amazon EC2 action, an Amazon EC2 Auto Scaling action, or a notification sent to an Amazon SNS topic. - A
composite alarmincludes a rule expression that takes into account the alarm states of other alarms that you have created. The composite alarm goes into ALARM state only if all conditions of the rule are met. The alarms specified in a composite alarm's rule expression can include metric alarms and other composite alarms.
Conclusion
Congratulations, you have learned a lot about observability in this article. We started with observability concepts which are critical to understand before moving into using any tool. We then delved into the deep dive of the One Observability Workshop with a focus on Logs and Metrics by reviewing what it takes to deploy the application on your own AWS account. Thereafter we reviewed the architecture of the PetAdoption Application and noted CloudWatch as the Observability tool to be leveraged for logs and metrics. We looked at several aspects of logs mainly querying and we reviewed metrics mainly on expressions, anomaly detection, custom metrics, metrics insights, embedded metric format and alarms. In order to keep it focused, this article did not cover the other aspects of the Observability Workshops such as X-Ray traces, Application monitoring, Insights, Dashboards and AWS managed open-source observability and the Use Cases. Do check out the References and Further Resources section for more on Observability Best Practices and Observability in AWS.
Acknowledgements
Special appreciation to Indika Wimalasuriya for providing invaluable insights during the final session of the #12WeekAWSWorkshopChallenge, Chi Che and Paula Wakabi the Challenge organizers for consistently and relentlessly supporting me through the challenge and Prasad Rao for the support by curating these AWS Workshops into 12 weeks of AWSomeness at https://12weeksworkshops.com/
Veliswa Boya, Sr. Developer Advocate at AWS for showing us the way when it comes to technical content creation and supporting developers across the African Continent and beyond.
A huge appreciation to the #12WeekAWSWorkshopChallenge Sponsors: Whizlabs (https://www.whizlabs.com/), EduCloud Academy (https://educloud.academy/) and the Become a Solutions Architect (BeSa) program (https://become-a-solutions-architect.github.io/)
References and further Resources
- [Blog] AWS Observability Best Practices
- [AWS Workshop] AWS One Observability Workshop
- [Video] Full stack Observability and Application Monitoring with AWS
- [Video Playlist] AWS native Application Performance Monitoring (APM) services
- [Video Playlist] AWS open-source Observability Services
- [GitHub Repository] AWS One Observability Demo
If you found this post insightful, feel free to leave a clap and follow for more posts.

